AREA OF NEPĀL – THEN AND NOW
AREA OF NEPĀL – THEN AND NOW
Published in GEO WORLD, Annual Geo-Spatial Magazine of GESAN, Vol -IV, January 2, 2021.
KEY WORDS: Maps, Digital Data, LRMP, Topographical
ABSTRACT
Area in measurement refers to the amount of space covered by a flat surface or piece of land, described as a measurement. In the simplest form area is calculated as the product of length and breadth in geometry. For complex polygons it is calculated by using formulae prescribed by coordinate geometry. Area of a country keeps changing with the changes in its international boundary. In case of Nepāl, the area was calculated in BS 2031 (1974 AD) for the first time. Since then the international boundary with its neighbors has changed several times and we have witnessed changes in area according to the maps produced in different times. With the recent publication of the administrative map of Nepāl in May 2020, we have the new area of Nepāl. Area measurement is affected by some technical factors like map scale, projection and sources used for map preparation.
1. BACKGROUND
Nepāl is an
independent, indivisible, sovereign country with territorial integrity. “Before
the Sugauli Treaty of BS 1873 (1816 AD), the western boundary of Nepāl extended
up to Kẫgaḍā, and the area measured as 367,575 sq. km. After losing some
territory to Sansar Chand and Ranajit Singh, the boundary of Nepāl was
contracted to Satalaj and the area measured as 204,917 sq. km.” (Ratan
Bhandari, “Atikramaṇ ko Chapetā mā Limpiyādhurā – Lipulek”, BS 2073, page 5). The
current boundary of Nepāl with its neighbor in the south, India, has been
defined by the Sugauli Treaty of BS 1873 (1816 AD), Supplementary Treaty of
December 8, 1816 AD, Agreement of November 1, 1860 AD and Agreement of January
7, 1875 AD and with the northern neighbor, China, by the Boundary Treaty of BS
2018 (1961 AD) and subsequent boundary protocols. As the time passed by, there
has been some refinements in the international boundary with our friendly
neighbors. There were some confusions in the boundary at some places,
especially in the southern plain mainly due to ever changing river courses and
lack of sufficient boundary pillars along the boundary line. After due
deliberations between friendly neighbors, most of the confusions/problems have
been resolved in technical level. There are still some confusions/problems/disputes
at some places and both countries have their own positions regarding the
ownership of the concerned land. Such confusions / problems / disputes are
being resolved at the diplomatic and political level.
Final area of a country can be defined only when its boundary with neighboring countries is finalized. Until then the area of a country may vary from time to time as the neighboring country resolve the boundary issues.
Similarly, the area of country may get refined with the invention of new methods and technologies for surveying and mapping. So, the area of a country may not remain same for all the time until the international boundary is finalized between the concerned countries.
2. AREA COMPUTATION
According to the Oxford Advanced Learner’s Dictionary the term “area” in measurement refers to the amount of space covered by a flat surface or piece of land, described as a measurement. With the help of “area” we can compare two or more features, which is bigger and which is smaller. In mathematics, for figures with rectangular shapes, we can calculate the area as the product of length and breadth. And the unit of the area is square of the units of linear measurement.
a = l * w,

Where, a – area, l – length and w – breadth.
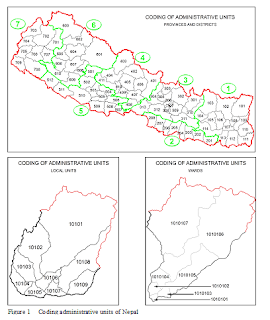
If the length and breadth are measured in centimeters, then the unit of area will be square centimeters, written as cm2 or sq.cm. Figure 1.
With this basic concept of calculating the area, the area for all other types of regular geometrical figures can be calculated. For example, area of circle, triangle, pentagon, hexagon, octagon and so on.
Knowing all three sides of a triangle, Heron’s formula can be used to calculate the area. In geometry, Heron's formula, named after Hero of Alexandria, gives the area of a triangle when the length of all three sides are known. Unlike other formulae for area computation of a triangle, there is no need to calculate angles or other distances in the triangle first.
Heron’s formula
states that the area, A, of a triangle whose sides have lengths a, b and c is,
figure 2
A= √[s(s –a)(s –b)(s –c)]
Where, s is the semi-perimeter of the triangle; that is, s = (a+b+c)/2
Area, A of a circle of radius r is calculated as A = p r2.

Area, A of an ellipse with semi-major axis a, and semi-minor axis b is calculated as
A
= p a b.
Area, A of a regular polygon is calculated as
where,
a = edge length,
n
= number of sides, Figure 3.
Calculation of irregular geometrical figures, like an irregular polygon with a number of sides of different lengths, is not straight forward. The trick to finding the area of an irregular polygon or complex shape is to break the shape up into regular polygons such as triangles and squares first, then find the area of those shapes and add them together to find the total. This is useful only when we have a polygon with a few vertices. It will be practically very difficult to compute the area of a polygon with, say, 500 vertices by this method.
The simple way to calculate the area of polygon is to use coordinate geometry.


If we look at the countries of the world, the outline polygon defining a country is very much complicated and such outline contains thousands of vertices. Many algorithms have been developed based on coordinate geometry and imbedded in software packages working with geographical information. So, computation of area of even complicated polygons is just a matter of mouse click in such software packages.
3. MAPS
We live on the earth, one of the several planets of our solar system. The earth is almost a perfect sphere with a radius of about 6366 Km. The surface of the earth consists of different natural and man-made features like forest, lakes, mountains, urban areas roads and so on. The earth is so big that we can’t see it at her completeness at one glance. To perform different activities of our needs, the features of the earth must be portrayed into a small form so that we can visualize a large part of the earth.
One of such small forms of the earth is a GLOBE. The globe is one of the most perfect representations of the earth. But the globe is not convenient to use for different purposes. For example, it is practically very difficult to perform linear measurements on a globe. The size of the globe would be very big, if we want to show more information on it. The radius of the globe would be about 64 meters to represent the earth at the scale 1:100 000. It takes a lot of space to store the globes. The globes are not convenient for carrying from one place to another. Since, the globes are generally made of metals or plastics, it is not convenient to add additional information in it.
So, it is more practical to represent the features of the earth onto a flat surface like a paper. This process of representing the features of the earth's surface onto a flat surface involves conversion from the curved surface of the earth into flat surface. The reduced and generalized, in a scientific way (map scale, map projection, coordinate system, symbolization), representation of the whole or a part of the earth onto a flat medium (generally a paper) is called a MAP.
Converting a sphere to a flat surface results in distortion. This is the most profound single fact about map projections—they distort the world. Imagine a map projection as an attempt to reconstruct your face in two dimensions. Some maps will get the shapes of all your features just right, but not the sizes—your forehead and chin, for instance, may come out huge. Other maps will get the sizes right, but the shapes will be stretched—maybe your full, round mouth will appear wide, thin, and rather mean.
Some maps preserve distances. Measurements from the tip of your nose to your chin, ears, and eyes will be right, even though the size and shape of your features is wrong. Other maps preserve direction. Your features may look weird, and they may be squeezed up or set too far apart, but their relative positions will be correct.
Finally, some maps are compromises—they get nothing exactly right but nothing too far wrong. In particular, compromise projections try to balance shape and area distortion.
So the four spatial properties subject to distortion in a map are Shape, Area, Distance and Direction.
4. MAPS OF NEPĀL
Due to mountainous nature of the terrain, lack of transportation, man power and financial resources, the mapping sector received less priority in Nepāl. In Nepāl most of the topographic maps were either prepared by a foreign organization or with the financial and technical assistance from donor agencies. The following are series of topographic maps covering whole country.

Land Resources Mapping Project, LRMP prepared a set of maps at scale 1:50 000 on the basis of “1 inch to a mile” topographic sheets and aerial photographs during 1970s/1980s.
The latest series of topographic maps of Nepāl were prepared by Survey Department with the technical and financial assistance of the Government of Finland at scales 1:25 000 and 1:50 000.
5. MEASUREMENT OF AREA ON THE BASIS OF DIFFERENT MAPS
Maps are prepared to fulfil certain needs. And, a specific system of map preparation (scale, projection, etc.) is selected to suit the goal of map.
In small scale maps all types of measurements (distance, area and angle) have certain level of inaccuracies due to generalization, nature of map projection and scale. The larger the map scale, more accurate the measurements are.
The equal area projections are used to portray the area of the field details more accurately. So, maps prepared in this type of projection is more suitable for the purpose of area measurement. Until few decades back, base maps of a country are prepared in a standard national system mainly on papers and using primary source of information. It is quite difficult and consumes much resources to change the projection of maps in manual working environment.
Different methods have been developed to measure area on the basis of maps. Use of graph paper, geometric method, Planimeter (mechanical and digital) are some popular methods to measure area in maps.
Now-a-days surveying and mapping methods are changing rapidly and progressively. Primary information are gathered or captured in digital form using field, aerial or space based technologies. The data are stored, processed, analyzed and presented in digital environment. In digital environment it is quite easier to edit, modify, improve and update the geo-information and maps based on such geo-information. Moreover, the software packages used for working with the geo-information, have tools to change the geo-information from one system to another making the life of a surveyor, cartographer and geo-informatician much easier.
5.1 Area of Nepāl based on the map published by Survey Department in BS 2031 (1974 AD):
Nepal Government (the then His Majesty’s Government of Nepāl), Ministry of Communication, Department of Information published “Mechī dekhi Mahākālī” in BS 2031 (1974 AD) – a set of books in four volumes describing all 75 districts of Nepāl. These volumes also include region wise maps of Nepāl at scale 1:500,000 published by Survey Department in BS 2031 (1974 AD).
According to these maps and data published in the book, the area of Nepāl is 145,305 sq. km.
5.2 Area of Nepāl based on the “1 inch to a mile” map published by Survey of India in 1950s – 1960s:
Due to lack of proper documentation in most of the government offices, the document describing the computation of area on the basis of “1 inch to a mile” map published by Survey of India in 1950s – 1960s could not be found. According to the officers working in this field, area of Nepāl was computed in the following way:
The total area of Nepāl was computed by the then Computing Section, Topographical Survey Branch under Survey Department in B.S. 2036 - 2037 (1979 – 1980 AD). Original color printed “1 inch to a mile” map sheets available at Survey Department were used to calculate the total area of Nepāl. At first, area of each district was measured on the corresponding map sheets using manual Planimeter. Each measurement of the part of the district within the corresponding map sheet was measured at least three times in order to come up with better results, and the mean value of each part was then calculated. The areas of each district was totaled. In this way, the areas of all districts were computed, and all the district area values were summed up to get the total area of Nepāl.
The area of Nepāl computed in this way was 147,181 sq. km. This figure was the official area of Nepāl since then.
5.3 Area of Nepāl based on 1:50 000 maps published by Land Resources Mapping Project (LRMP), Survey Department in BS 2043 (1986 AD):
Land Resources Mapping Project (LRMP) under the grant aid from the Canadian International Development Agency (CIDA), Canada had prepared a series of map sheets at the scale of 1:50,000 on the basis of “1 inch to a mile” topographic sheets available from the Survey Department and the aerial photographs (scales 1:40,000, 1:60,000) flown during the winter periods of BS 2035 – 2036 (1978-1979 AD) supplemented by field verifications. In total, 266 map sheets were prepared to cover whole Nepal. LRMP had produced the 1:50,000 map series for Land Systems, Land Utilization, and Land Capability; while, the geological map sheets at 1:125,000 scale, and a series of climatological map sheets at 1:250,000 as well were printed.
The area of each unit of Land Systems, Land Utilization, and Land Capability map sheet series was measured in each map sheet, using digital Planimeter at least two times. Areas of all units in a sheet were then summed up and compared to the theoretical area of the corresponding sheet and introduced corrections as required. The corresponding units of each district from a map sheet were then calculated from the measurements. In this way, total area of each district was computed.
The area of Nepāl computed in this way was 147,482.64 sq. km.
5.4 Area of Nepāl based on the topographical maps published by Survey Department in BS 2049 – 2058 (1992 – 2001 AD):
The latest series of topographic maps of Nepāl were prepared with the technical and financial assistance of the Government of Finland. The maps were prepared during 1992 – 2001. The maps are based on aerial photographs of 1992 (eastern part of Nepāl) and 1996 (western part of Nepāl). High mountains and Himalayas are mapped at 1:50 000 (116 map sheets) and rest of the country at scale 1:25 000 (509 map sheets). Lumbinī zone has not been covered in this map series since it was covered by Lumbinī Zone Topographical Mapping Project maps at scale 1:25 000.
The maps are published in 6 colors. Modified UTM projection was used for mapping. Three 3° zones with central meridians 81°, 84° and 87° E were used improve the mapping accuracy.
A 1:25 000 map sheet covers an area bound by 7’ 30” longitude and 7’ 30” latitude. Similarly a 1:50 000 map sheet covers an area bound by 15’ longitude and 15’ latitude. 1000 meters grids are superimposed in all maps.
The latest series of topographic maps of Nepāl at scales 1:25 000 and 1:50 000, including Lumbinī zone maps have been converted into digital form by Survey Department and are available for public use. For digitization original color separates were used to ensure higher accuracy. PC ARCINFO, ArcView 3.*, R2V and CadCore software packages were used. FORTRAN was used to compute the projected coordinates of the points for geo-referencing. The RMS error of 0.006 m was maintained in geo-referencing. The adjoining sheets were merged and edited as required and database for each 3° modified UTM projection zone was prepared. Database of zones with central meridians 81° E and 87° E were converted into the zone with central meridians 84° E. The database was then converted into decimal degree system referred to the Everest 1830 spheroid.
Based on the national topographic database, Survey Department has prepared a series of other databases at 1:100,000, 1:250,000, 1:500,000 and 1:1,000,000 scales. Database at scale 1:1,000,000 can be downloaded from http://nationalgeoportal.gov.np/ or http://dos.gov.np/nepal-map.
Survey Department has prepared a series of maps of Nepāl on the basis of this database. Recently, Survey Department has adopted Lambert Conformal Conic Projection for the preparation of small scale maps of the country.
On the basis of the database at scale 1:1,000,000 published by Survey Department before the inclusion of Nepal’s integral part, Limpiyādhurā, in it, the area of Nepāl is as follows. ArcGIS 10.x has been used to compute the area of Nepāl in different map projection systems.

5.5 Area of Nepāl according to the United Nations Organization:
According to the
information published by United Nations Organization through http://data.un.org/en/iso/np.html (accessed October
01, 2020) the surface area of Nepal is 147,181 sq.km.

5.6 Area of Nepāl based on the latest topographical database published by Survey Department in May 2020:
Nepal Government
published the latest administrative map of Nepāl including its integral part
Limpiyādhurā in the map in May 20, 2020.
On the basis of the database at scale 1:1,000,000 published by Survey Department after the inclusion of Nepal’s integral part, Limpiyādhurā, in it, the area of Nepāl is as follows. ArcGIS 10.x has been used to compute the area of Nepāl in different map projection systems. The boundary section Lipulekh – Limpiyādhurā has yet to be demarcated in land (see Explanation/Discussion).
For district wise area computed at different times and projection systems, please, refer to the table at the end of this article.

6. EXPLANATION/DISCUSSION
The area of Nepāl calculated on the basis of maps prepared in different times is different. It is obvious from the fact that the international boundary have been refined after the due deliberations with the neighboring countries.
As explained before, the area varies according to the nature of projection selected for mapping. Principally, the area calculated on the basis of map in equal area projection is more accurate compared to that from map in other projections.
Similarly, the scale of map used for measuring the area also affects the accuracy of the result. The larger the map scale more accurate the measurement is.
In all above cases, except the digital data, the maps used for measuring area are the printed as hard copy maps. The “1 inch to a mile” toposheets were prepared during 1950s – 1960s. The printed map sheets might have deformed with the lapse of time. And there are equal chances of human errors as well. The equipment and the methodology used to measure the area also have their role in the accuracy of the results.
The considerable difference between the areas of Nepāl based on the map published by Survey Department in BS 2031 (1974 AD) at scale 1:500,000 and “1 inch to a mile” topographic maps published by Survey of India may be explained by the difference of map scale and a few changes change in the boundary between Nepāl and China. The area of Nepal computed on the basis of “1 inch to a mile” (map scale 1:63,360) 147,181 sq. km. is much accurate compared to the area 145,305 sq. km. based on 1:500,000 scale map published in “Mechī dekhi Mahākālī” in BS 2031 (1974 AD).
The difference between the areas of Nepāl based on the “1 inch to a mile” topographic maps published by Survey of India and LRMP maps at scale 1:50,000 published by Survey Department may be attributed to the map scale, use of modern equipment for area measurement, perception of boundary between Nepāl and India and change in Nepāl China boundary after the first joint field inspection and signing in the second Nepāl-China Boundary Protocol in BS 2045 (1988 AD) where there have been changes at some places along the Nepāl-China boundary. According to an estimation by B.N. Shrestha [“Nepālako Simānā” (Boundary of Nepāl), Ratna Sāgar Publication (P.) Ltd., Fourth Edition, BS 2073 (2016 AD), page 360], Nepāl has gained about 302.75 sq. km. land. The area of Nepāl 147,482.64 sq. km. computed on the basis of LRMP maps at scale 1:50,000 is more accurate than the area computed on the basis of “1 inch to a mile”.
The area of Nepāl, 147,645.63 sq. km., computed on the basis national topographic database created on the basis of the latest series of topographical maps at scale 1:25,000 and 1:50,000, before the inclusion of Limpiyādhurā in it, is much more accurate compared to the area calculated previously. Increase in area compared to the previously computed area may be attributed to the source of data (GPS based aerial photograph), map scale (1:25,000 and 1:50,000), clarifications of boundary between Nepāl and India, use of modern photogrammetric facilities and GIS software packages.
And, finally the area of Nepāl, 148,006.67 sq. km., based on the latest topographical database published by Survey Department in May 2020 after the inclusion of Limpiyādhurā in it is the final area of Nepāl as of now. Technically it is more accurate since it has been calculated on the basis of the latest digital database and the area has been calculated in equal area projection.
Upon checking the latest topographical database published by Survey Department in May 2020 with the ArcGIS online topographic base map, the boundary between Nepāl and China at Lipulekh – Limpiyādhurā sector is not following the watershed. Boundary along this sector is yet to be finalized between Nepāl and China.
Generally we work with planar system while dealing with the measurements from maps. PLANAR lines calculate areas without accounting for the curvature of the earth, and utilize simple two-dimensional Cartesian calculations.
Surface of the earth being curved, we should work with the Geodesic system for accurate measurements from maps. GEODESIC lines are the shortest distance between two points; this is equivalent to the great circle on a spherical datum. Computation in this system is slow, but highly accurate. The geodesic area of Nepāl before the inclusion of Limpiyādhurā in it is 147,651.26 sq.km. The geodesic area is 148,006.67 sq.km. according to the latest topographical database published by Survey Department in May 2020 after the inclusion of Limpiyādhurā.
7. CONCLUSION / RECOMMENDATION
1. Computation of area of countries is a complicated process and involves intricate formulae.
2. Area of a country can’t be finalized until its international boundary with neighboring countries is finalized.
3. The accuracy of area calculated from map(s) depends upon the map scale, projection, method of data acquisition (primary, secondary), methods and tools used for the computation.
4. Area of Nepāl, 148,006.67 sq. km., based on the latest topographical database published by Survey Department in May 2020 after the inclusion of Limpiyādhurā in it is the final area of Nepāl as of now. Technically it is more accurate since it has been calculated on the basis of the latest digital database and the area has been calculated in equal area projection. This is evident even when we compare it with the geodesic area.
5. A round figure 148,000 sq. km. may be declared as the area of Nepāl for all general official purposes.
8. ACKNOWLEDGEMENT
I would like to thank Mr. G.P. Bhatta, former Director General, Survey Department for encouraging me to write on this topic; Mr. P.P. Oli, former Director General, Survey Department for going through my write up on the area calculation on the basis of “1 inch to a mile” topographic sheets; Mr. R.M. Tamrakar, former Chief Survey Officer, Survey Department for going through my write up on the area calculation on the basis of “1 inch to a mile” topographic sheets and LRMP sheets. Similarly, my thanks are due to Mr. B.N. Shrestha and Mr. R.K. Sharma former Director Generals, Survey Department for their valuable suggestions during the preparation of this article.
9. REFERENCES
www.mathopenref.com/coordpolygonarea.html
Area Calculator – Find the Area of 10 Geometric Shapes. Retrieved September, 20 2020, from https://www.inchcalculator.com/area-calculator/
His Majecty’s Government of Nepal, Ministry of Communication, Department of Communication, Volume I – IV, BS 2031 (1974 AD). Mechī Dekhī Mahākālī.
http://data.un.org/en/iso/np.html Retrieved October 01, 2020.
http://dos.gov.np/nepal-map Retrieved October 01, 2020.
Kennedy, M. & Kopp, S. Understanding Map Projections, GIS. ESRI.
Kraak M.J. & Ormeling F.J, 1996. Cartography: Visualization of Spatial Data. LONGMAN.
LRMP Economic Report, 1986, appendix V
Ratan Bhandari, “Atikramaṇ ko Chapetā mā Limpiyādhurā – Lipulek”, BS 2073 (2016 AD).
Robinson, A.H., Morrison, J.L. & others, 1995. Elements of Cartography, Sixth Edition. John Wiley & Sons, INC.
Shrestha, B.N., BS 2073 (2016 AD). Nepālako Simānā (Boundary of Nepāl). Ratna Sāgar Publication (P.) Ltd., Fourth Edition.
Shrestha, S.M., BS 2064 (2007 AD) Less Means More – NTDB: At Scale 1:100,000. Nepalese Journal on Geoinformatics, Number 6. Annual Publication of Survey Department, Government of Nepal.
Snyder, J.P., 1987. Map Projections - A Working Manual. USGS Professional Paper 1395, US Government Printing Office, Washington.
District wise area in Sq.Km.:


Comments
Post a Comment