CODING THE ADMINISTRATIVE UNITS OF NEPAL FOR DATA INTEGRATION AND VISUALIZATION
ABSTRACT
The
value of data increases by multifold if they are presented in spatial
context. For the meaningful use of data,
the data table and the spatial component, the map, should be processed and
prepared in such a way that they can be integrated easily. Common identification code for data and map
units (point, line or polygon) is the key to this integration.
1 INTRODUCTION
For any development tasks to be formulated,
scheduled, implemented and monitored, people need information. Nature is the ultimate source of all kinds of
information. Almost all information is
there with her, we just have to discover them for our needs. The information discovered should be passed
to others so that they can use that information for the benefit of the society.
Developments in the field of electronics, for
example fax (facsimile) machines, video cameras, CD players, printing press,
personal computers, digitizing devices, softwares etc. have been the characteristics
of the last few decades.
Organizational communication is important in every
business. People in organizations need
to communicate to coordinate their work and to inform others outside the
business about their products and services.
All these developments in the modes of communication have helped map –
makers to produce more effective maps, a graphic method of information
communication and sharing.
In this communication process a large variety of
professionals are involved. For example,
map makers, data producers, planners, decision makers, and map / data users to
list a few. No single organization can
accomplish all these tasks on its own.
So, there is a need to design a mechanism to integrate the information
from a wide range of sources so that we can produce meaningful products on
which the planning and further actions can be based.
1.1 Maps
We live on the Earth, one of the several planets of
our solar system. The earth is almost a
perfect sphere with a radius of about 6,366 Km.
The surface of the earth consists of different natural and man-made
features like forest, lakes, mountains, urban areas roads and so on. The earth is so big that we can’t see it at
her completeness at one glance. To
perform different activities of our needs, the features of the earth must be
portrayed into a small form so that we can visualize a large part of the earth.
One of such small forms of the earth is a
GLOBE. The globe is one of the most
perfect representations of the earth.
But the globe is not convenient to use for different purposes. For example, it is practically very difficult
to perform linear measurements on a globe.
The size of the globe would be very big, if we want to show more
information on it. The radius of the
globe would be about 64 meters to represent the earth at the scale 1:100
000. It takes a lot of space to store
the globes. The globes are not
convenient for carrying from one place to another. Since, the globes are generally made of
metals or plastic, it is not convenient to add additional information on it.
So, it is more practical to represent the features
of the earth onto a flat surface like a paper.
This process of representing the features of the earth's surface onto a
flat surface involves conversion from the curved surface into flat surface. The reduced and generalized, in a
scientific way, representation of the whole or a part of the earth onto a flat
medium (generally a paper) is called a MAP.
With the development in the fields of Computer and Information
Technology, Geographical Information System, Surveying and Mapping
Technologies, professionals have started to make, disseminate and use maps in
digital forms.
Map making is a very professional, time and cost
consuming task. So, generally, the base
maps are prepared by a National Mapping Authority of the Government, for
example, Survey Department in Nepal. The
latest series of topographic base maps (1992 – 2001) at scales 1:25,000 and
1:50,000 have been digitized to create National Topographical Database in
digital form. On the basis of this
database, Survey Department has generated digital database at scales 1:100,000,
1:250,000, 1:500,000 and 1:1,000,000.
The database at scale 1:1,000,000 is freely available from the
Department’s web site. Apart from other
data layers, this 1:1,000,000 scale database consists of an administrative boundary
layer.
1.2 Map as an interface to data
Maps have been used for centuries to visualize and
understand the ground reality. Map users
understand different natural and artificial phenomena on the basis of
appropriate maps. Different information
such as distances, directions, volumes, areas, interrelationship between two or
more phenomena can be derived from a map.
Maps contain different types of spatial data. Spatial data refer refers to objects or
phenomena having specific location in space.
Spatial data can be divided into two categories viz. geometric and
attribute data. The first refers to the
geometrical aspects (location and dimension) of the phenomenon and the second
refers to other, non-geometrical aspects.
For example, district wise population density map of Nepal. In this case, the boundary lines defining the
given district are the geometric component and population density is the
attribute component of the given spatial data.
Maps are made, in essence, from different data
sources viz. geometric data about the ground features and attribute data
related to different feature units.
Surveying (ground surveying or remotely sensed surveying) and existing
maps are major sources for the geometric data.
Attribute data are collected by different agencies viz. organizations
responsible for census, forest, agriculture, education, health and so on. In this way maps act as an interface to
visualize the data in much more meaningful way.
1.3 Usages of maps
Consciously or unconsciously we use maps in our
daily life. When somebody asks us about
how to go to certain place, we first of all make a mental map in our brain and
direct that person on how to reach there.
These days use of open source web maps has been a
common practice. These maps are
generally prepared by international professional organizations/groups in
collaboration with government organizations and interest groups.
Almost all people use maps. Maps are very useful for different types of
engineering works. Engineers construct
different structures first on the maps.
Different calculations can be done in maps. For example, we can calculation of length,
area and volume. Some other map users
are a vehicle driver, a scientist, a teacher, tourist, planners and decision
makers, emergency service provider etc.
2 CURRENT ADMINISTRATIVE STRUCTURE OF NEPAL
According to the Constitution which came into effect
on Sept 20, 2015, Nepal has 7 provinces with 77 districts. In due course of time 753 local units (6
Metropolitan Cities, 11 Sub- Metropolitan Cities, 276 Municipalities and 460
Rural Municipalities with 6,743 wards in total) were formed. So, the wards are the smallest administrative/political
units in Nepal. Each ward consists of a
few settlements.
The boundaries of these local units are not marked
on the ground. Mostly, the natural and
man-made features (ridges, rivers, roads etc) represent the boundaries. In many cases, especially in case of areas
declared as “designated areas” (National Parks, Hunting Reserves, Conservation
Areas), there are confusions on the boundaries.
The boundaries of the settlements are not yet mapped in Nepal.
3 INTEGRATING DATA WITH MAPS
Basically, the process of combining data from
different sources to create a unified view may be called data integration. Data integration always results in a value
added product, saves time, creates environment for better collaboration between
different organizations and assist in the knowledge-based and informed decision
making process.
Mostly, the data and derived information are
published in tabular form. For the
decision makers and planners, it is neither easy nor comfortable to visualize,
analyze and decide on the basis of such data in tabular form which lacks
spatial component.
By integrating data with maps, one can derive more accurate
insights, clearly see the spatial distribution of the data, compare with other
relevant data and can generate information in spatial context based on which
more reliable, reasonable and practical plans can be designed for the
betterment of the society.
3.1 Data collection
For national, provincial and district level planning
purposes, different government agencies collect data throughout the
country. National Planning Commission,
Central Bureau of Statistics (CBS), Ministry of Education, Science and
Technology, Ministry of Health and Population, Ministry of Agriculture and
Livestock Development, Ministry of Industry, Commerce & Supplies, Election
Commission and so on collect the data required to fulfill their organizational
mandates. The Census data are collected
by the Central Bureau of Statistics (CBS) once in a decade.
The Census data are generally aggregated in ward
level. Most of the other data are
aggregated by the local units and districts.
3.2 Coding the mapping units
The key to integrate the data with maps is to
establish national codes for administrative units, linear and point features
represented in maps and use them throughout all agencies collecting data and
making maps.
In order to integrate the tabular data with the map,
one needs to relate the row of data in tabular form to a specific unit in the
map data. This is done by assigning a
common code to the row of data in tabular form and corresponding unit in the
map data. The common code may be text,
number or alphanumeric. More practical
way of coding is to assign numbers to all units. Due to lack of uniformity in names of
geographical and man-made features, it is not practical to use such names as
common codes.
3.3 Usefulness / benefits of codes of mapping units
In absence of common code for the mapping units, one
has to rearrange the data table or map data to make the data integration
possible. And it takes a lot of time and
man-power. Having common codes for
mapping units, we can easily use data collected by any other organization and
it is one of the main ideas of the principle of data interoperability and cost
saving.
4 CODING ADMINISTRATIVE UNITS AND OTHER FEATURES IN THE PAST
Until the recent past, different agencies were using
different codes for the then districts and lower level administrative
units. For example, Survey Department
and Central Bureau of Statistics were assigning different codes for districts
of Nepal.
Attempts were made to use common codes and as a result
a “National Standard” was developed and published. But, in practice it was not followed. The reason may be that the different agencies
found it comfortable to work with the codes practiced in their own organizations.
Apart from the administrative units, Survey
Department has developed a list of feature codes for all point, line and
polygon features presented in the base map of Nepal. The feature code list is available at www.ngiid.gov.np
maintained by Survey Department. But,
the codes for individual point, line and polygon features are yet to be worked
out.
5 CODING ADMINISTRATIVE UNITS OF NEPAL
Now, the administrative structure has been
changed. Accordingly, their codes have to
be revised. A new coding system suitable
for the current administrative structure should be designed.
The Central Bureau of Statistics (CBS) has already
developed a new coding system according to current administrative structure. Each local unit is given a five digit number,
for example, for Dharan, the code is 11301.
The first digit represents the province number (1 – 7), next two digits
represent the district number and last two digits represent the local unit
number.
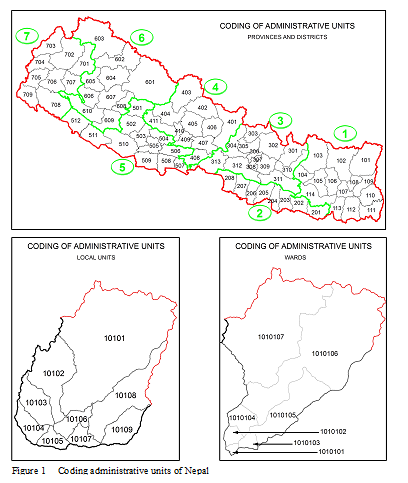
According to the system adopted by Central Bureau of
Statistics for the numbering of districts, firstly, districts are numbered from
1 in each state and as much as possible the numbering starts from the district
of north east side of the state and continues in “S” direction. Then the geographic code of a district is
manipulated as an alignment of state geographic code and district serial
number. For example, the serial number
of Taplejung district is 01 and it falls in state 1, then its geographic code
will be 101. Same principle is adopted
for local units in each district. Figure
1.
There is no hard and fast rule for coding
administrative units. However,
considering our eye rhythm during writing and reading, we print written
materials with the words arranged horizontally left to right. To read this
material, the eye moves left to right along a line of type and then sweeps to
the left and down to the beginning of the next line. This suggests the coding process to start
from left to right along a line and down to the beginning of the next line. This may be one of the agenda for discussion
among the concerned agencies.
6 DATA VISUALIZATION
Primarily the data are collected in pre designed
forms – in hardcopy or digital format.
Eventually, the collected data are arranged in tabular form – database
table.
|
|
Generally, the human brain perceives information more clearly and quickly in the form of maps, charts and graphs than in the form of table or reports. In broader context, individual data has very little meaning. For example, the population of Kathmandu Metropolitan City is just a figure. But, when the populations of all Local Units are considered, it gives information on different aspects of population. And one can identify the areas which need attention.
After proper data integration, one can visualize the
data in the form of map, charts, and graphs.
Maps are more effective tool for visualization and proper understanding
of the data. One can see the trend of
the data including spatial component.
With the in-built tools in the GIS software packages like ArcGIS, QGIS, we can
analyze and visualize the data as per our requirement.
7 CONCLUSION
Mapping and data collection are highly professional
tasks and the government allocates a huge amount of resources for their
creation. This national investment
should be used at optimum level so that the information can be used for the
pre-directed national development.
Developing a common code for mapping and data
collection units along with the standardization of mapping and data format are
the keys to make the data integration possible.
Coding of the mapping units should be widely
discussed among all concerned agencies and a system agreed upon by all
concerned agencies should be brought into practice.
8 RECOMMENDATIONS
1. Map
producer, Survey Department and data producers should work in close
coordination so as to produce more meaningful products.
2.
National
Standards on coding of mapping features should be revised to reflect the
current changes in the administrative structures of the country. For this, all the stake holders may sit
together for meaningful discussion.
3. The
National Code should be complete as far as possible. For example, the codes of administrative
units developed by The Central Bureau of Statistics (CBS) may be extended to
incorporate wards and settlements by adding two digits for wards and two (or
three) more digits for settlements.
4. The
National Code should also incorporate other features like highways, airports, headquarters,
and designated/protected areas and so on.
5. The
National Code should be passed by the Mapping Committee and enforced throughout
the country.
9 REFERENCES
1. "Definitive
Guide to Data Integration". Talend,
https://www.talend.com
2. "Geographical
Coding of States, Districts and Local units". National Planning
Commission, Central Bureau of Statistics, Nepal, 2017 B.S.

Very informative and useful article Suresh ji.
ReplyDelete