ONE PLUS ONE IS MORE THAN TWO – MAKING OF THE POPULATION AND SOCIO-ECONOMIC ATLAS OF NEPAL
Survey Department and Central Bureau of Statistics are two major data
producers of HMG
1. BACKGROUND
Government deals with everything from the delivery of health services to environmental protection to maintaining transportation infrastructure. Geography is the one common element that unites information in these diverse activities. The benefits from geographically based information management – eliminating redundant work, better allocation of resources, consistency of information and improving operational efficiency – can only be fully utilized through coordination between entities. Partnership between government and the private sector, between government agencies, and between different units of an agency must continue to be developed and strengthened.
Though different agencies have used GIS extensively for years, this use has often not been obvious. In many agencies GIS is integrated into the operations of large departments such as forest management or transportation rather than being centralized in a separate agency. GIS use by different agencies is expanding and transforming from traditional planning or monitoring applications to applications focused on management, decision support, and information transfer.
The role of government as an intermediary between different agencies has made it more acutely aware of the value of integrating operations and exchange information using GIS. One prominent organization of the government, National Geographic Information Infrastructure Programme (NGIIP), is dedicated to helping different agencies effectively use information and information technologies, particularly GIS, for decision support.
2. WORKING TOGETHER
Information is usually stored in a tabular format, quite often in hardcopy. With the development in the field of computer technology and software industry, it is now general practice that data are recorded and stored in digital files. Though using such data has many advantages over hardcopy files, it is still quite difficult to visualize the information in the spatial context.
Maps are one of the fundamental assets of the country. The
volume and quality of maps may be a measure of understanding the development
status of a given country. In
To fulfill the growing need of digital topographic data, SD has prepared
a set of digital topographic database (NTDB) from the existing base
maps. Preparation of the NTDB is a big step forward in the
mapping history of
On the other hand Central Bureau of Statistics (CBS) is responsible for
conducting National Population Censuses in
Neither SD alone nor CBS alone can produce such maps. Here comes the essence of "One plus one is more than one". The result of the joint effort of SD and CBS is not only useful for them but also for a wide group of other different users, sharing their resources in the overall national development.
Realizing this need, His Majesty’s Government (HMG) of Nepal has included a “Mapping Component” in the Population and Housing Census 2001. One of the main objectives of the Population and Housing Census 2001: Mapping Component Project assisted by European Commission is to disseminate the results of Population and Housing Census 2001 in different forms viz. tables, maps (hardcopy, CD ROM and web maps). One of such information dissemination forms is “The Population and Socio-Economic Atlas of Nepal”.
3. IMPLEMENTATION STRATEGY
“The Population and Socio-Economic Atlas of Nepal” is basically an atlas based upon the results of the Population and Housing Census, 2001. However, some very pertinent socio-economic indicators from other sources have also been included.
Preparation of the Atlas was managed by a three-tire structure of academic and technical teams. They are Panel of Advisors, Editorial Committee and Technical Taskforce. Panel of Advisors consisted of well-known national experts in the field of Population Study, Sociology, Statistics, Economics, and Geography etc. Editorial Committee consisted of experts from SD and CBS in the field of mapping, GIS, Demography, Economics, statistics etc. The Director Generals of SD and CBS are also there in the Editorial Committee. Technical Taskforce consisted of the experts from SD and CBS in the field of mapping, GIS and statistics.
Panel of Advisors is basically responsible for advising and reviewing the content of the Atlas. Editorial Committee is responsible for finalizing the working methodology; approve individual maps and the Atlas as a whole. Technical Taskforce is responsible for making required data tables, find appropriate data classification method, aggregate data in higher level viz. district, Eco-Development Region and Development Region, link those tables with respective spatial data and produce effective map in a specific design.
4. SPECIFICATION
The following are the general specification for the Atlas:
1 Language: English,
2
Size:
B3 Europe (353 mm * 500 mm),
3
Color: Multi
colors,
4
Cover: Hard
cover,
5 Each page contains one, two,
four, eight or sixteen maps depending upon the theme,
6 Data aggregation has been
done at district level for maps showing whole Nepal, except in case of a
few maps, where data has been shown for VDC/Municipality.
7
Each map page has a brief description of the indicator being mapped,
8
Data at district level are presented for each indicator.
5. PREPARATION OF SPATIAL DATA
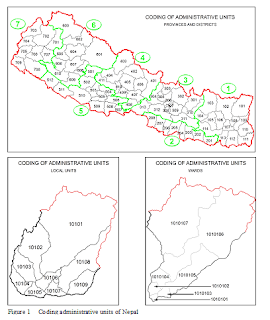
Spatial data showing administrative boundaries (country, development region, eco-development region, district, and VDC/Municipality) has been prepared from the NTDB prepared by SD.
The digital data for the base maps (topographic maps at scales 1:25 000
and 1:50 000) are stored in the sheet level. There are 682
such data sets in total. Since those data sets are prepared in
three 3° zones, it is required to convert all data sets into one
system.
Since the codes for different administrative units used by Survey Department and Central Bureau of Statistics are not the same, a new field for entering CBS codes is created in the attribute table of the spatial data and codes entered accordingly.
6. PREPARATION OF ATTRIBUTE DATA
Population Censuses in
Two types of forms / schedules were introduced to collect information on sample as well as hundred percent count. The detail of sampling scheme employed in census 2001 is provided in Population Census Report published by CBS in July 2002. The short form represented the complete count of the basic information of household, and individuals. While, the long form represented the sample enumeration of other detailed demographic, social and economic variables at the individual level as well as at the household level. As cross cutting issues the census has focused on gender issues and the issues of women, men, children and the disabled.
In the Atlas, the attribute data is primarily from Population Census 2001, but there are several other indicators derived using datasets based on Agriculture Census 2001/2002 conducted by CBS, Census of Manufacturing Establishments 2001/2002 conducted by CBS, Health related data from Department of Health, and School educational data from Ministry of Education and Sports. For mapping purpose, all attribute data are stored in the *.dbf format.
7. CONTENT OF THE ATLAS
After a series of discussions with the members of the Panel of Advisors
and Editorial Committee, it was decided to include 210 themes (6 general
maps of
8. SOFTWARE USED FOR MAPPING
ArcView GIS 3.1 is the sole software used to classify the data and map accordingly. It has been customized to efficiently produce maps for “The Population and Socio-Economic Atlas of Nepal”. Occasionally, for editing the attribute data MS Excel has also been used.
The default facilities available in ArcView GIS 3.1 are not sufficient to compose efficient thematic maps. To meet the requirements many tools have been developed. For example, tools for creating different types of circles, pie charts, and other geometric figures. Similarly, tools for creating standard layout are also developed to ensure uniform standard map layouts.
9. FROM DATA TO MAP
Most of times the data itself gives very little information to the data user. The same data becomes a major source of information, if it is visualized in a map. But, If the data is presented in a map in “as it is” condition, the resulting map may be quite difficult to perceive and understand the given phenomenon. Useful maps can be made only if they are composed in a systematic manner keeping in the mind the information those maps are to convey to the users. In order to make such meaningful and effective maps a Cartographer should understand the following steps.
9.1. Classification of data:
For the proper visualization and meaningful use of an indicator, the data must be grouped in such a way that the resulting presentation shows the basic facts from the data. Classifying data should help to enhance insight in the data. However, to make sense, the number of classes should be limited. “Research has revealed that humans can handle up to a maximum of seven classes to get an overview and understanding of the theme mapped at a single glance.” [Cartography: Visualization of Spatial Data, M.J. Kraak & F. Ormeling]. Mathematical approach can be applied to find out the class boundaries.
9.2. Joining attribute and spatial data:
In ArcView corresponding theme (VDC / Municipality, District, Eco-Development Region or Development Region) is loaded and its attribute table opened. Next the table containing the data being mapped is loaded and is joined to the attribute table of the theme on the basis of common code field.
9.3. Symbolization:
The mapping units are coloured as per the nature of the data. In most of the cases the data are presented with respect to the national average value of the indicator being mapped. In doing this colours are chosen to depict the positive and negative nature of the indicator in comparison to the national value.
Additionally, the data are presented with the help of different geometric symbols like circles, pie, bars, squares, and so on. This helps the map user to perceive the absolute figure being mapped.
9.4. Preparation of layout:
In general each map sheet in the Atlas consists of a map of Nepal showing district wise data at 1:2 000 000 scale, map of Nepal showing Eco-Development Region, and Development Region wise data at 1:6 000 000 scales. A brief text to elaborate the indicator being shown is included in each map sheet. Similarly, for easy reference district wise data are presented in tabular form as well.
9.5. Preparation for printing:
For mass printing of maps we still have to rely on the printing press. Mass production of maps using printer / plotter is economically not feasible for now. But the digital working environment has replaced certain phases in the total process of map printing. For example, we do not need to make peel-coats, scribe sheets etc for map printing. Colour separates are directly made from the digital file and this means saving money and time.
9.6. Exporting layout:
For further preparation for printing, the layout is exported into PostScript (EPS) file with 720 dpi resolution.
9.7. Colour separates:
Four colour-separates (Cyan, Magenta, Yellow, and Black) are printed from the corresponding EPS file. For single colour sheets (texts) only one colour-separate is printed. Press Touch and PSM 7 are used to make colour-separates. Colour-separates are printed in Kodak film with the help of Creo DOLEV 450 machine.
9.8. Printing Plates:
The colour-separates are used to prepare corresponding printing plates,
which in turn are used to print maps. The plates are from the
9.9. Map Printing:
Maps are printed with the help of Polly Brand Checz / Module:755 / 5 colour 19’ * 26” offset printing machine with CPS and IR drive.
The “Population and Socio-Economic Atlas of Nepal” is currently available
from NGIIP, Survey Department, Minbhawan,
10. CONCLUSION
“The Population and Socio-Economic atlas of
The population and socio-economic data is dynamic in its nature and hence the updated version of the Atlas is a must.
Survey Department with joint efforts with other data generating agencies can produce different types of thematic atlases to benefit the users and assist in the overall national development.
Using different codes for the same administrative unit by different organizations create problems during data sharing. It is highly recommended to standardize such codes.
Building of a good team is a must for the success of this type of work. Contribution of each member in this team is highly commendable.
Private sector is found quite capable in reproduction of map products. The jobs defined in the paragraphs 8.7, 8.8, and 8.9 are performed by Variety Printers Pvt. Ltd., TU Road, Kuleshore, Kathmandu.
Survey Department has little time for the dissemination of this product. It should quickly develop dissemination strategy and bring the product at the hands of the users.
Since, censuses are taken every ten years in

Comments
Post a Comment